
Light My Cells Challenge Results
In order to contribute to the development of new image-to-image ‘deep-label’ methods in the fields of biology and microscopy, the Light My Cells challenge main task was to predict the best-focused (output) images of several fluorescently labeled organelles from label-free transmitted light (input) images. Or in other words, to recover fluorescence images by computer from transmitted light images.
This objective was made possible thanks to the structuring role of France BioImaging, which has allowed the creation of a new database of more than 57,000 images.
For our first challenge, we had 215 registrations and 11 participating teams from around the world. After a preliminary test phase - on 36 test images to familiarize with the new data and the submission procedure- the participating teams evaluated their methods during the final test phase on 322 images.
Many thanks to all involved for their hard work !
From the data contributors to the challenge participants !
🏆 We are delighted to announce our participants winners :
🥇 tle1302 team with a modified VQGAN code_access
🥈 eternalaudrey team with a Bag of experts (UNet and UNETR with ViT encoder) code_access
🥉 IWM team with a modified RUNet code_access
We would also like to thank and reward the three data contributors who have provided us with the most data and associated metadata, both qualitatively and quantitatively.
🏅 Oriane Pourcelot, IGH, CNRS
🏅 Julio Mateos, MRI, IGH, BioCampus, CNRS, INSERM, UM
🏅 Virginie Georget, MRI, CRBM, BioCampus, CNRS, INSERM, UM
Now, let’s make way for results !
We chose a total of 5 evaluation metrics, including:
-
Three for intensity : Mean Absolute Error (MAE), Similarity Index Measure (SSIM), Pearson Correlation Coefficient (PCC)
-
and two for textures: Euclidean distance & Cosine distance.
These metrics were all calculated for Nucleus & Mitochondria, while only SSIM and PCC were calculated for Tubulin & Actin. However, as the metrics are defined in different ranges, we group them by the rank of each metric. Then, we take the mean of the metric ranks to group them.

The ranking of the final phase of the challenge can be divided into 4 sections. The first method with modified VQGAN stands out from the rest. Then the other 4 methods in the top 5, which are relatively close despite their differences, with modified U-Nets ranging from classic CNN encoders to Vision Transformers. Then the second part of the top 10, which includes Pix2pix and U-Net more or less coupled with GAN. Last but not least, the 11th method is a relatively standard one using an array of U-Nets.
As this challenge aims to recover specific fluorescent organelles, let's take a look at the participants' rankings by organelle: Nucleus, Mitochondria, Tubulin and Actin.
![]()
![]()
![]()
![]()
In fact, some models are better only on certain organelles, but none
dominates them all. Nevertheless, we can see that the first always
remains in the top 3 rankings - first for nuclei and actin and second
for mitochondria and tubulin - while the ranking of the other
participants is more variable.
We then wanted to go a step further and see if there was a correlation between ranks and microscope modalities of the evaluated images : Bright Field (BF), Phase Contrast(PC) and Differential Interference Contrast (DIC).


We can see that the BF ranks are the closest to the general leaderboard. Indeed, due to the imbalance of the training database - which contains 41213 Bright Field images for 3499 Phase Contrast and 7670 DIC images - the participant models learned more on BF images than on the other modalities.
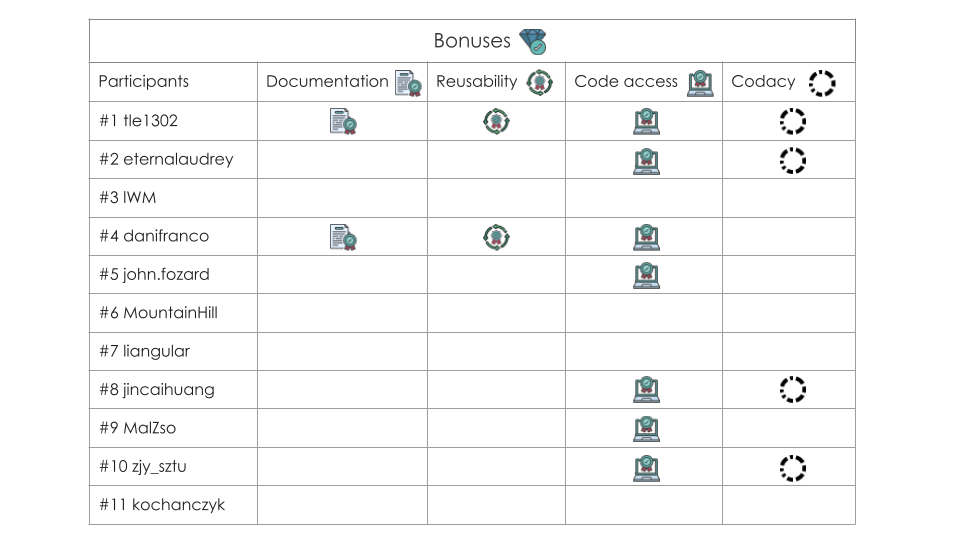
Finally, we defined the table of bonuses awarded to participants.
These bonuses have no impact on the learderboard and have been defined
on 4 main axes: documentation quality, code access, code reusability and
finally the Codacy score.
Documentation concerns both the presence and quality of the Readme, and the docmentation in the code. The Codacy score is based mainly on issues (Average percentage of issues of your repositories relative to the expected baseline.), file complexity (Average percentage of complex files in your repositories.) and duplicates (Average number of duplicated files in your repositories.). More information here https://www.codacy.com/.
In doing so, we wanted to recognize the involvement and efforts of participants, whatever their rank. So we've chosen to award badges instead of rankings.
We would particularly like to highlight the work of BiaPy (danifranco),
which is a mature, documented tool applied to our challenge. The Codacy
score has therefore not been applied for a fair comparison between the
others.
Thank you all for your efforts!
Icons from FreePik #juicy_fish
![]()
More details forthcoming with our presentation at the 21st IEEE International Symposium on Biomedical Imaging (ISBI) in Athens (May 27-30, 2024) https://biomedicalimaging.org/2024/.
Annexe
All learderbord ranks for all participants with all metrics for all organelles. More information on our final leaderboard.
